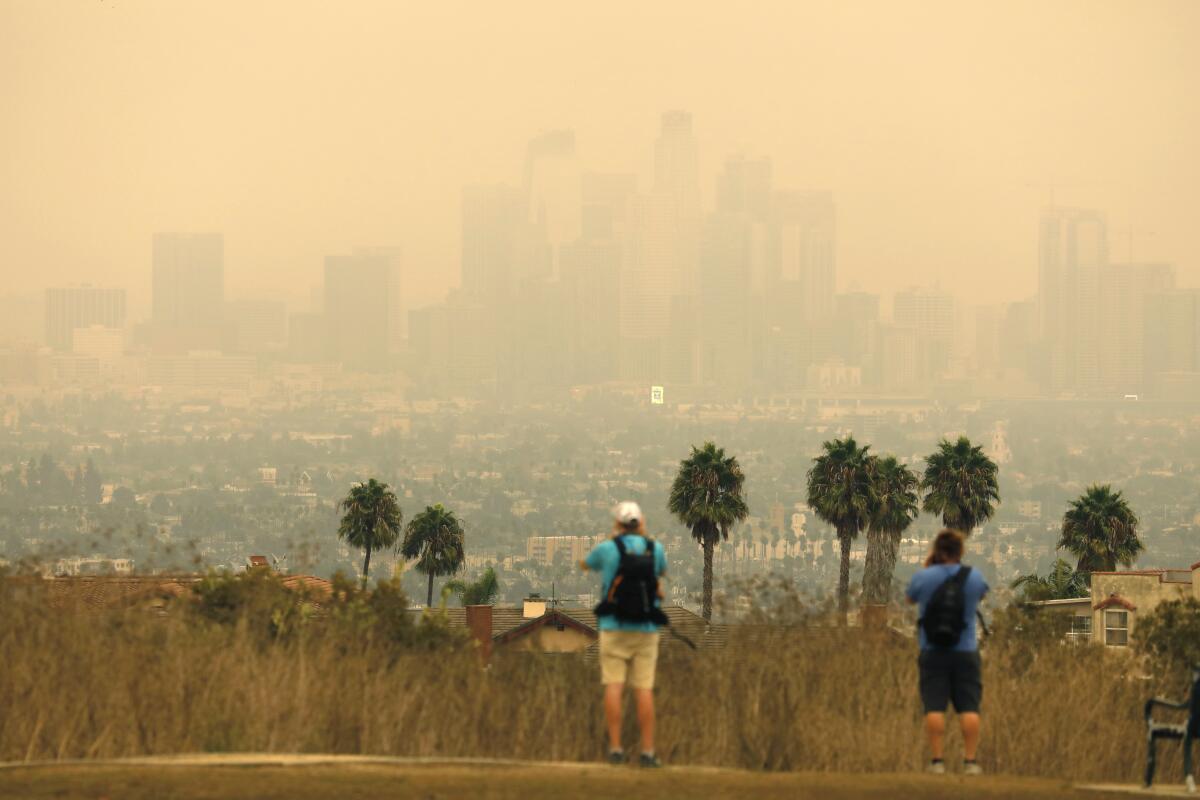
Pollution and Privilege
Air quality disparities in California align with demographic and socioeconomic factors, with cleaner air in predominantly white areas with higher MediCal coverage and poorer air quality in minority communities with mixed private and MediCal coverage.

An evident trend emerges when examining the racial demographics of the 10 California counties with the highest and lowest AQI values.
Counties with lower AQI levels, indicating cleaner air and shown on the rightmost bar graph, tend to have predominantly white populations. Notably, 7 out of 10 of these counties have populations that are at least 70% white.
In contrast, counties with higher AQI levels, signifying poorer air quality and shown on the leftmost bar graph, have a greater presence of ethnic minorities, primarily Hispanic and Black populations. Strikingly, all 10 of the California counties with the highest AQI values have white populations below 45%, a stark difference from those with cleaner air.

A similar pattern emerges when examining the racial demographics of the 10 counties with the lowest PM2.5 levels, another indicator of having cleaner air. In these counties, shown on the rightmost bar graph, 7 out of 10 have populations that are more than 60% white.
Conversely, in counties with the highest PM2.5 levels, indicating prolonged exposure to fine particulate pollution and shown on the leftmost bar graph, there is significantly greater racial diversity. These areas have higher representations of Hispanic, Native Hawaiian and Pacific Islander, Black, and Asian populations. Notably, only 2 out of 10 of these counties have populations that are more than 60% white.
Overall, this data suggests a relationship between air quality and racial demographics in California counties. The trend indicates that counties with cleaner air (lower AQI and PM2.5 values) tend to have predominantly white populations, while counties with poorer air quality (higher AQI and PM2.5 values) have a greater proportion of minority populations, such as Hispanic and Black.
A possible explanation for this relationship could come from the fact that, historically, marginalized populations have been more likely to live in areas with higher pollution levels due to systemic factors such as redlining, industrial zoning, and economic barriers. These communities typically have less political influence to advocate for stricter environmental regulations, cleaner infrastructure, and pollution control measures.
These findings are extremely important and can be connected to other valuable studies. In Allegheny County, Pennsylvania, from 2010 to 2018, it was found that AQI was “associated with asthma exacerbations among children in Allegheny County… driven primarily by PM2.5, with Black and younger children particularly affected” (Rosser, 2022). This study highlights that Black children are especially vulnerable to the health effects of poor air quality. Our data shows that California’s Black populations are more concentrated in areas with the worst air quality. Given the established link between air pollution and respiratory illness, these disparities could lead to severe and disproportionate health consequences for these communities.

This graph presents the Insurance Demographics of the 10 Counties with the Highest and Lowest Average AQI levels. The left chart shows that the counties with the highest average AQI levels tend to have a higher MediCal coverage percentage than counties with lower AQI levels. Madera County has a MediCal coverage percentage of 72.94%, Kings county has a MediCal Coverage percentage of 57.49%, and Kern county has a MediCal coverage percentage of 54.85%. In comparison, the highest MediCal coverage percentage out of all of the lower AQI counties is only 50.55% in Monterey.
The right chart shows that a majority of the counties with the lowest average AQI levels have a more balanced percentage of MediCal and private insurance coverage, compared to the higher average AQI level counties. Sonoma County has 30.13% of their population with MediCal and 31.77% with private coverage. The other counties in this chart include Monterey, Santa Cruz, Amador, Siskiyou, Trinity, Humboldt, Lake, Del Norte, and Mono.

This graph presents the Insurance Demographics of the 10 Counties with the Highest and Lowest PM2.5 Levels. Again, the left chart shows that a majority of the counties with the highest PM2.5 values have a higher MediCal insurance coverage percentage. Madera has a MediCal percentage of 72.94%, while Kings and Kern counties have a MediCal percentage above 54%.
The right chart shows that a majority of the counties with the lowest average PM2.5 Levels have a slightly lower percentage of MediCal insurance coverage, with none of the counties in this chart (San Luis Obispo, Sonoma, Inyo, Humboldt, Del Norte, Santa Cruz, Nevada, Monterey, San Benito, and Lake) exceeding a 51% MediCal coverage population.
Counties with the highest AQI and PM2.5 levels tend to have higher MediCal coverage rates; this could be due to lower-income populations, a higher concentration of agricultural or industrial jobs that do not provide private insurance, and greater health risks from pollution.
On the other hand, counties with the lowest AQI and PM2.5 levels tend to have a more balanced mix of private and MediCal insurance coverage. These areas are often less densely populated, have fewer industrial activities, and contain a mix of employment sectors, including higher-paying jobs that offer private insurance. Additionally, with cleaner air and potentially better health outcomes, there may be a lower dependence on public healthcare services compared to high-AQI regions.
Note: Some of the counties were filtered out because they contained null values in AQI or PM2.5 values